25.4 Performance measurement
The performance for a classification task is measured with a confusion matrix
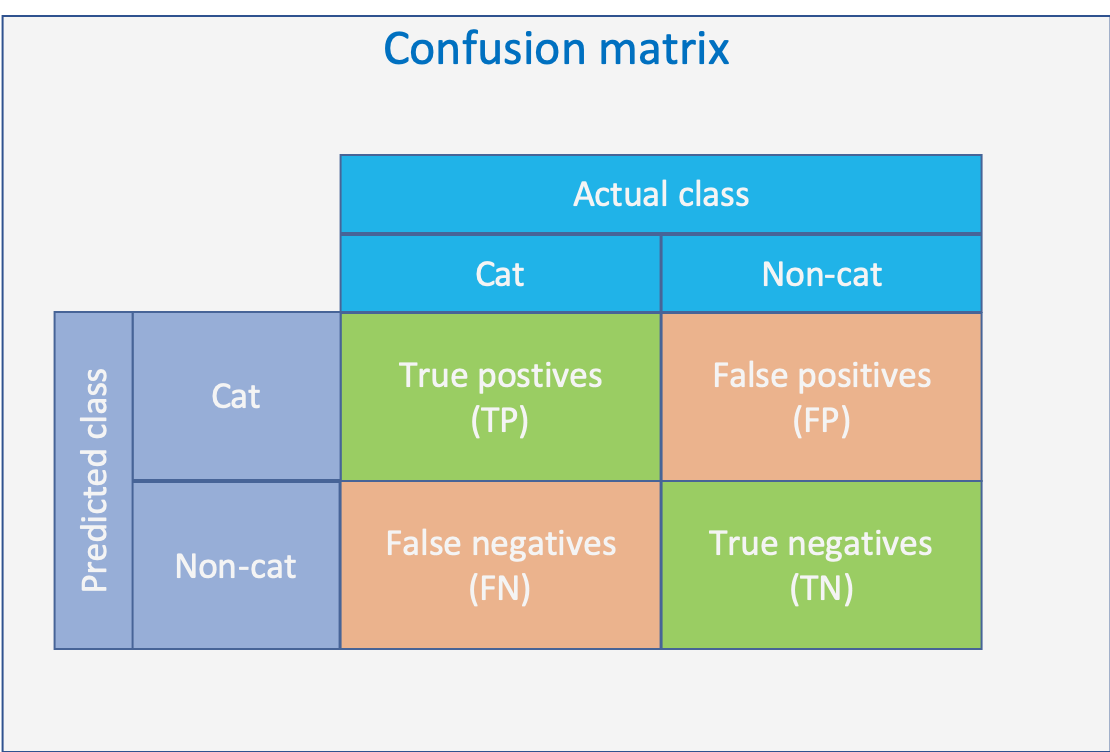
For more serios scenarios the false predictions can have severe impact:
- FP: False prediction
- Healthy person is unesseary troubled
- FN: False negative
- Ill person does not get necessary treatment
Based on the four elements of the confusion matrix various metrics are defined, for details check https://en.wikipedia.org/wiki/Confusion_matrix
25.4.1 Sensitivity and specificity
Two metrics which are derived from the confusion matrix are:
Sensitivity is the proportion of cats which have been identified as cats, or the proportion of people with the illness that have been identified as being ill. It is therefore also called probability of detection
Sensitivity => P(cat predicted | cat given)
\[ \ Sensitivity = \frac {\text{Sample with cat and predicted cat}} {\text{Samples having cat}} = \frac{TP}{TP+FN} \]
Specificity is the proportion of non-cats which have been identified as non-cats, or the proportion of healthy people which have been identified as healthy.
Specificity => P(non-cat predicted | non-cat observed)
\[ \ Specificity = \frac {\text{Sample with non-cat and predicted as non-cat}} {\text{Samples with non-cat}} = \frac{TN}{TN+FP} \]
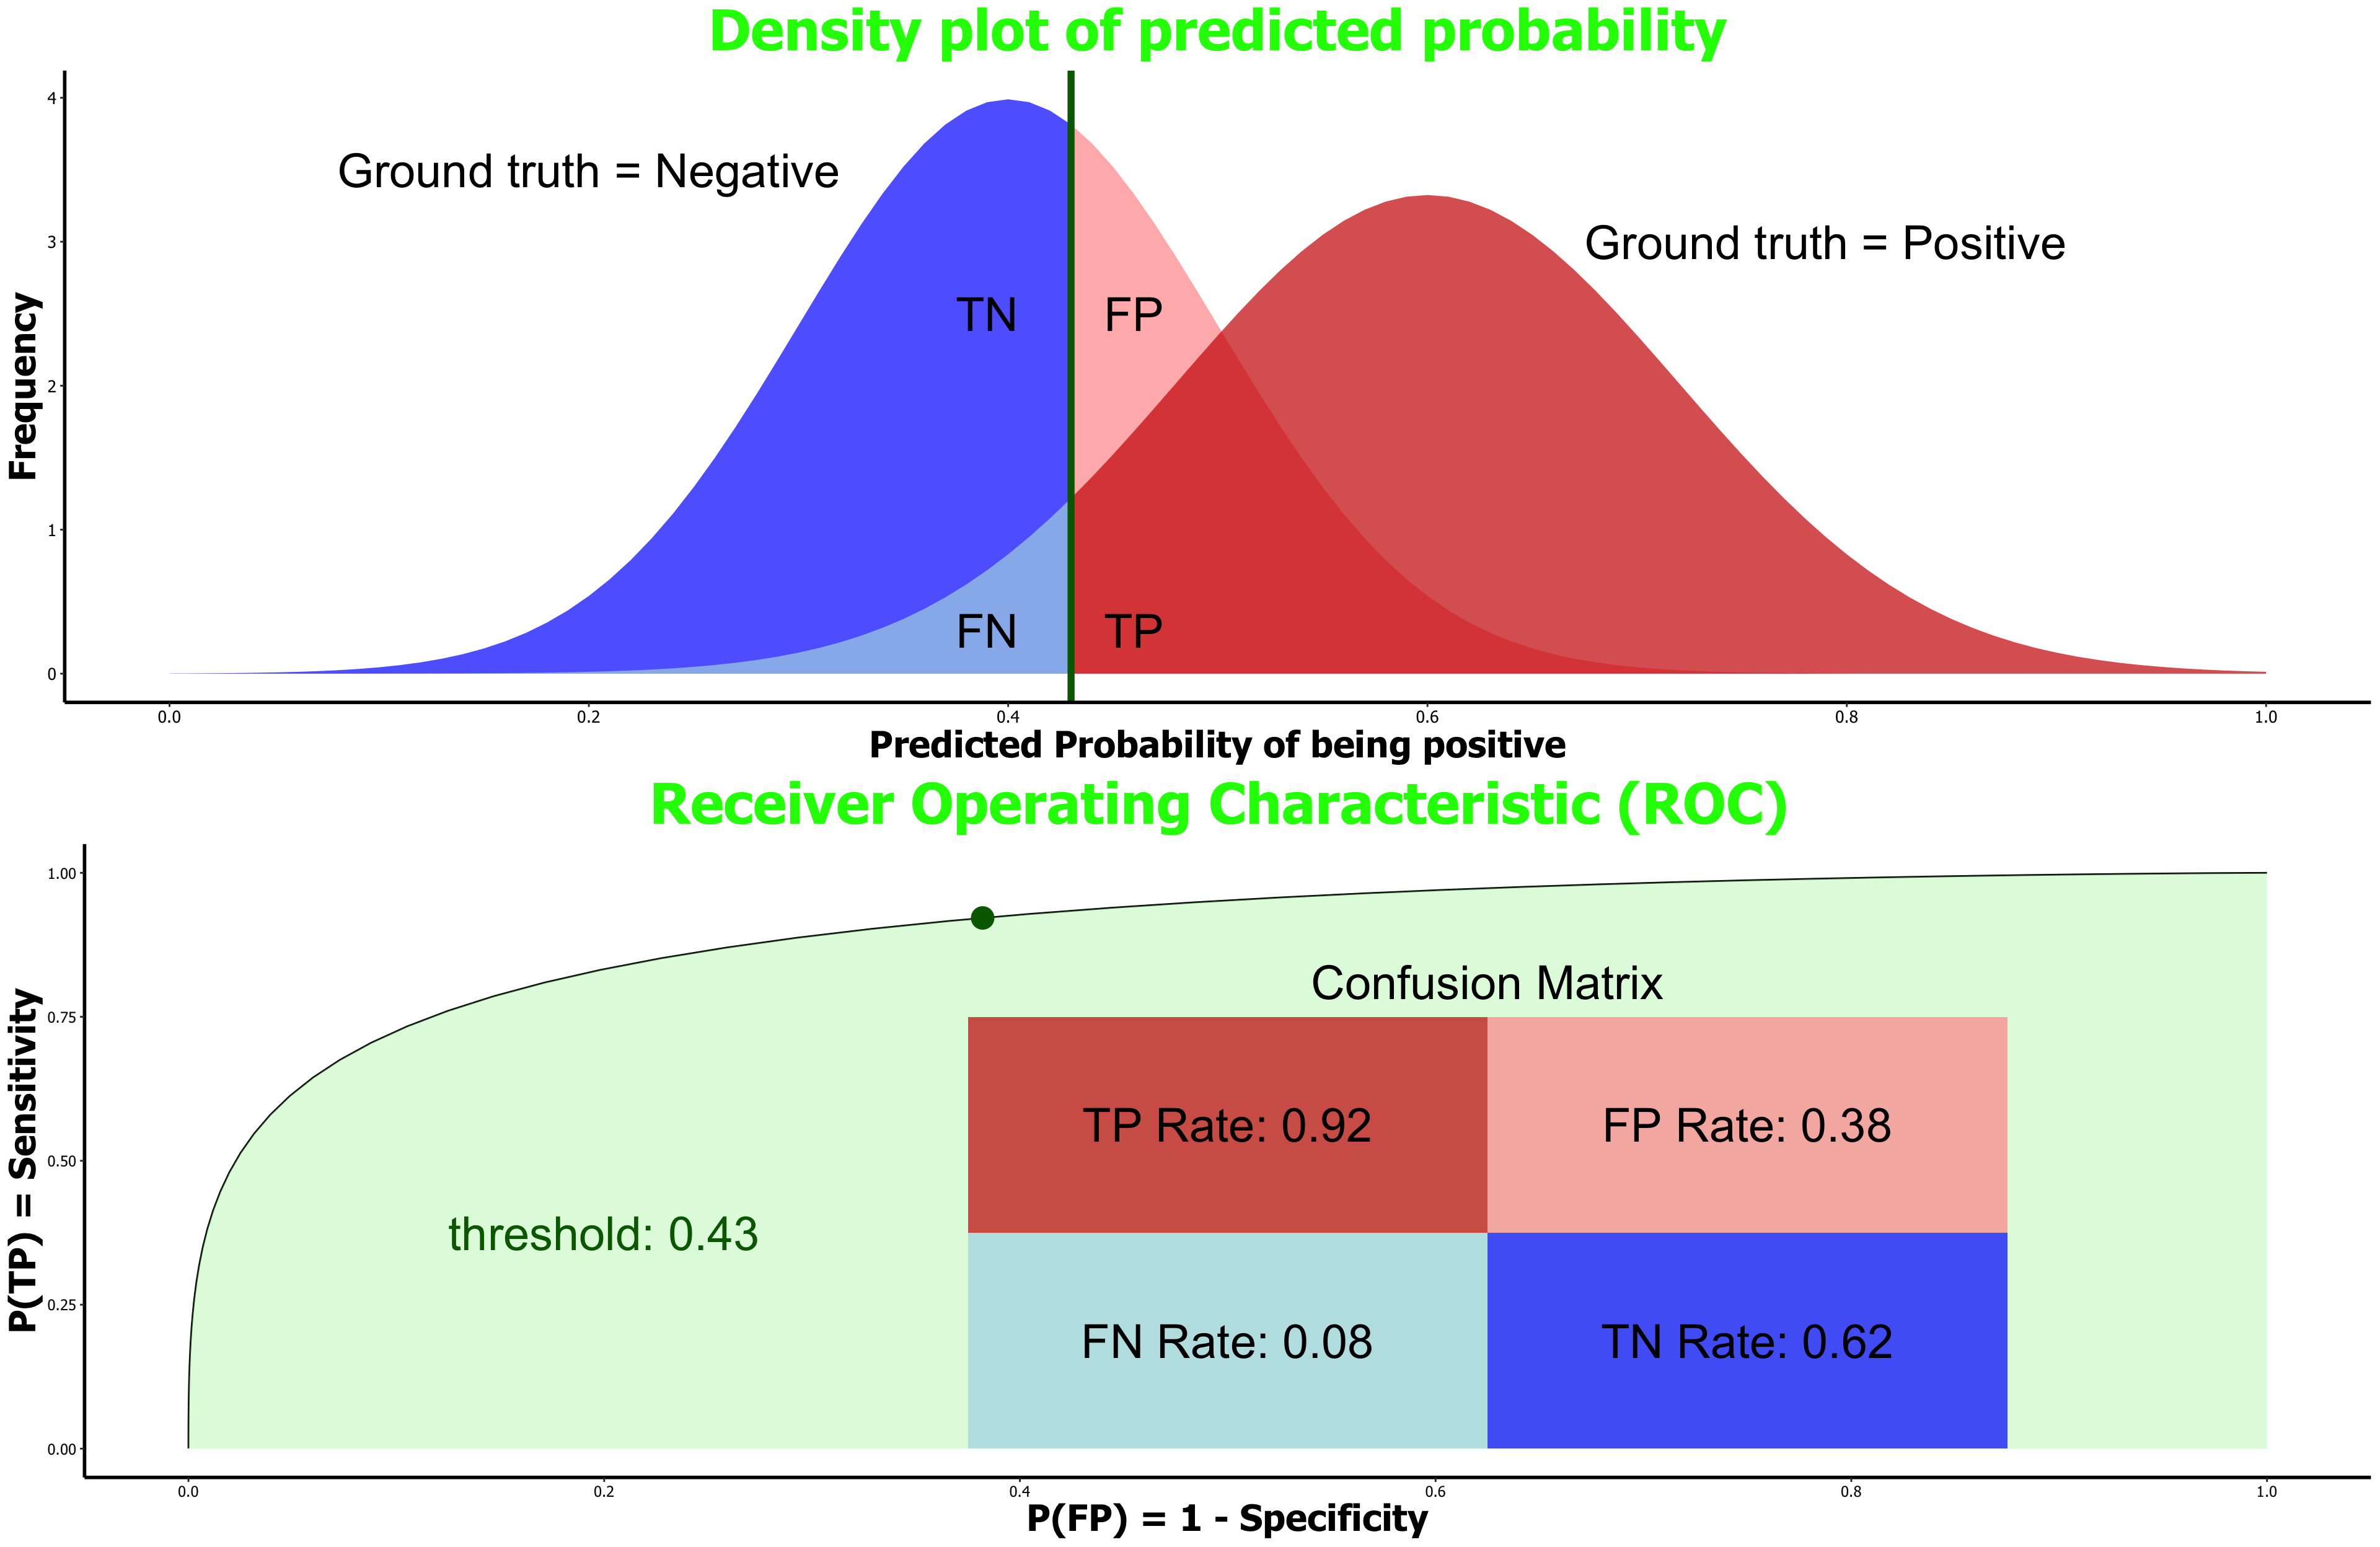
25.4.2 Receiver operating characteristic (ROC)
The result of a classification with two classes (binary classification) is given as a percentage value of how sure the algorithm is that the sample belongs to a class. Depending on the the overall project target the threshold upon which the class is rated as identified is set. If a false positive is to be avoided than the threshold for classifying a positive is set high.
- Used to set the probability threshold of detection
- Visual representation of confusion matrix
- Includes for various probability thresholds
- Sensitivity
- Specificity
- AUC => area under curve
- The higher the better
- 0 < AUC < 1